This article describes how to use Azure monitor to collect memory usage from virtual machine instances in scale set.
Memory related metrics are guest operating system level metrics, vm had to enable "log analytics agent" which collects monitoring data from the guest operating system and workloads of virtual machines in Azure, other cloud providers, and on-premises. It collects data into a Log Analytics workspace, then we can add alert rule with the monitoring data.
environment setup:
setup monitoring for vmss:
- enable vmss insights and config send monitoring data to log analytics workspace
- in monitor create a new alert rule
Videos:
Environment setup:
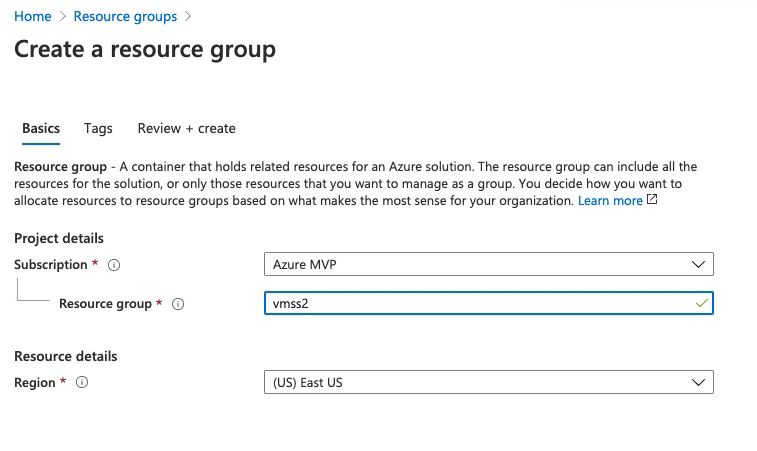
1.create resource group
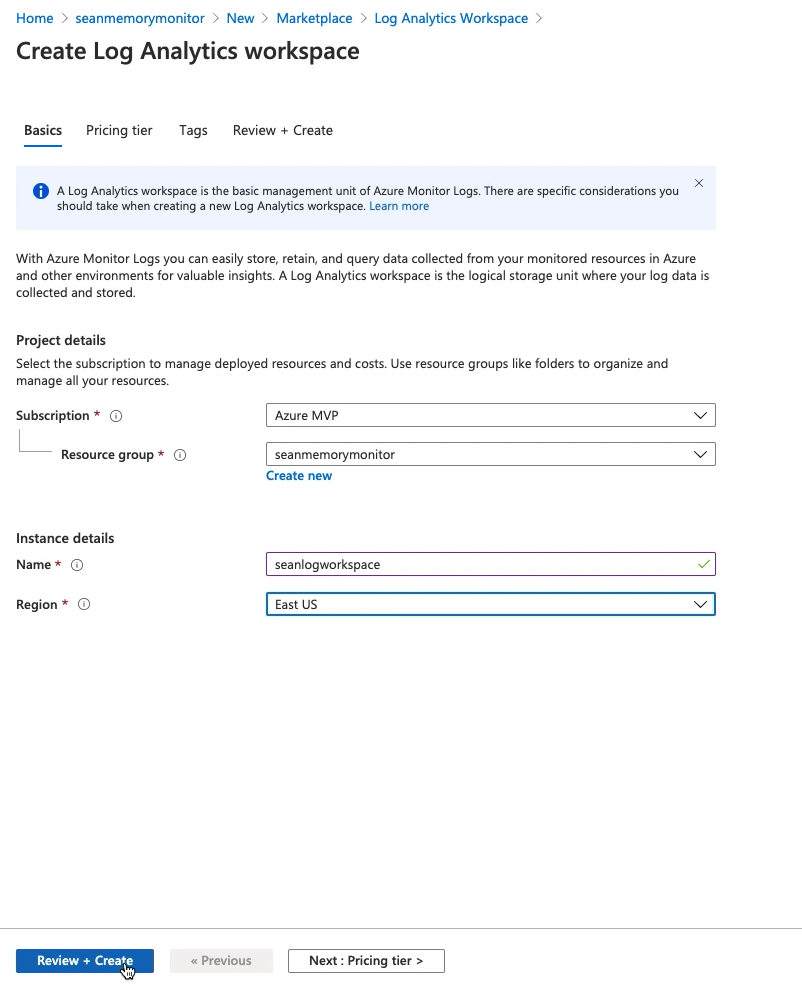
2. create log analytics workspace
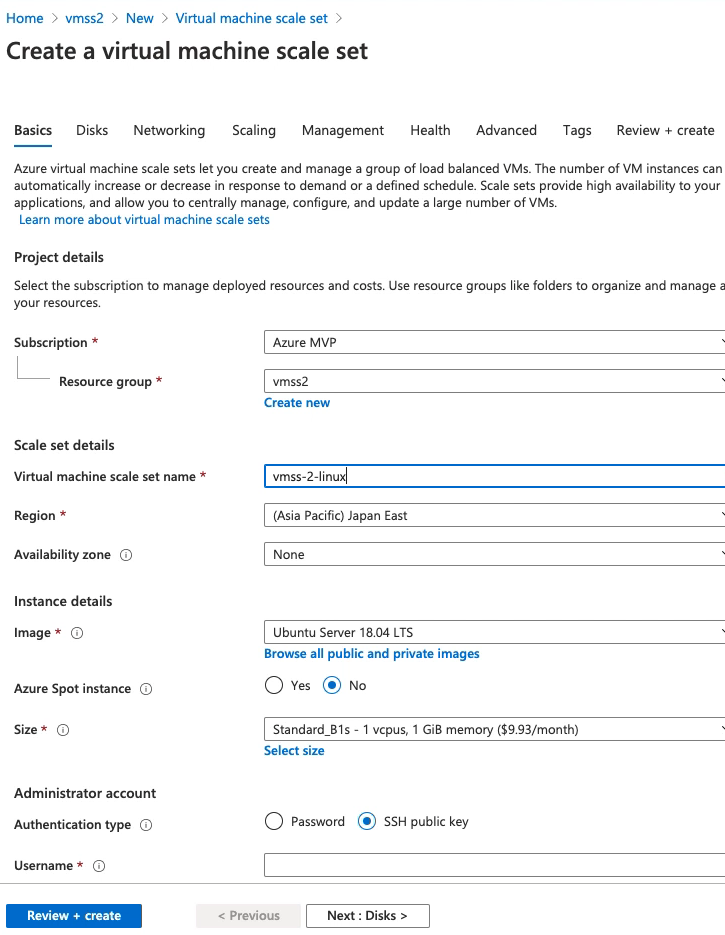
3. create virtual machine scale set
Setup memory monitoring for vmss:
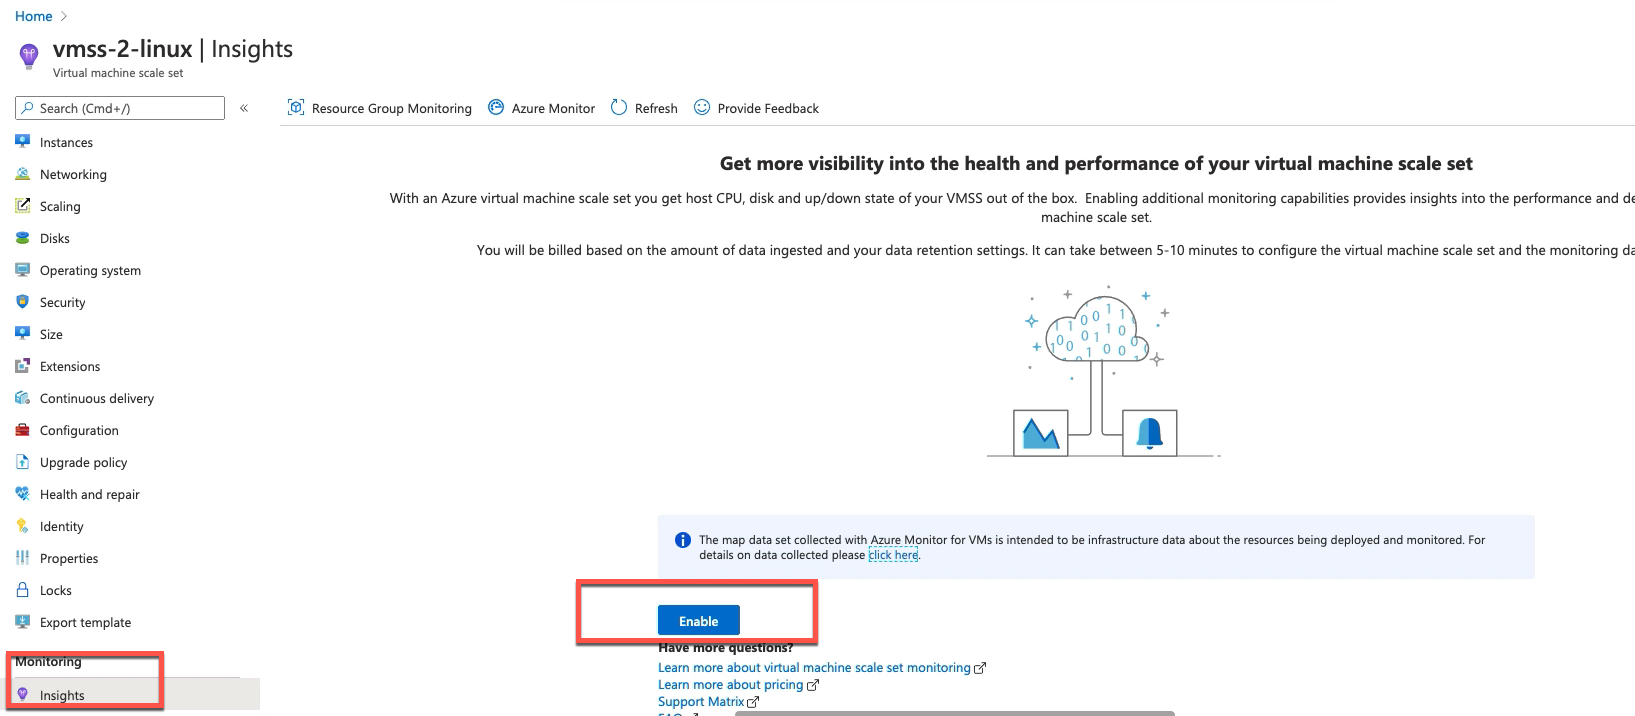
1.enable vmss insights and config send monitoring data to log analytics workspace
in vmss monitoring tab, click insights, click enable:
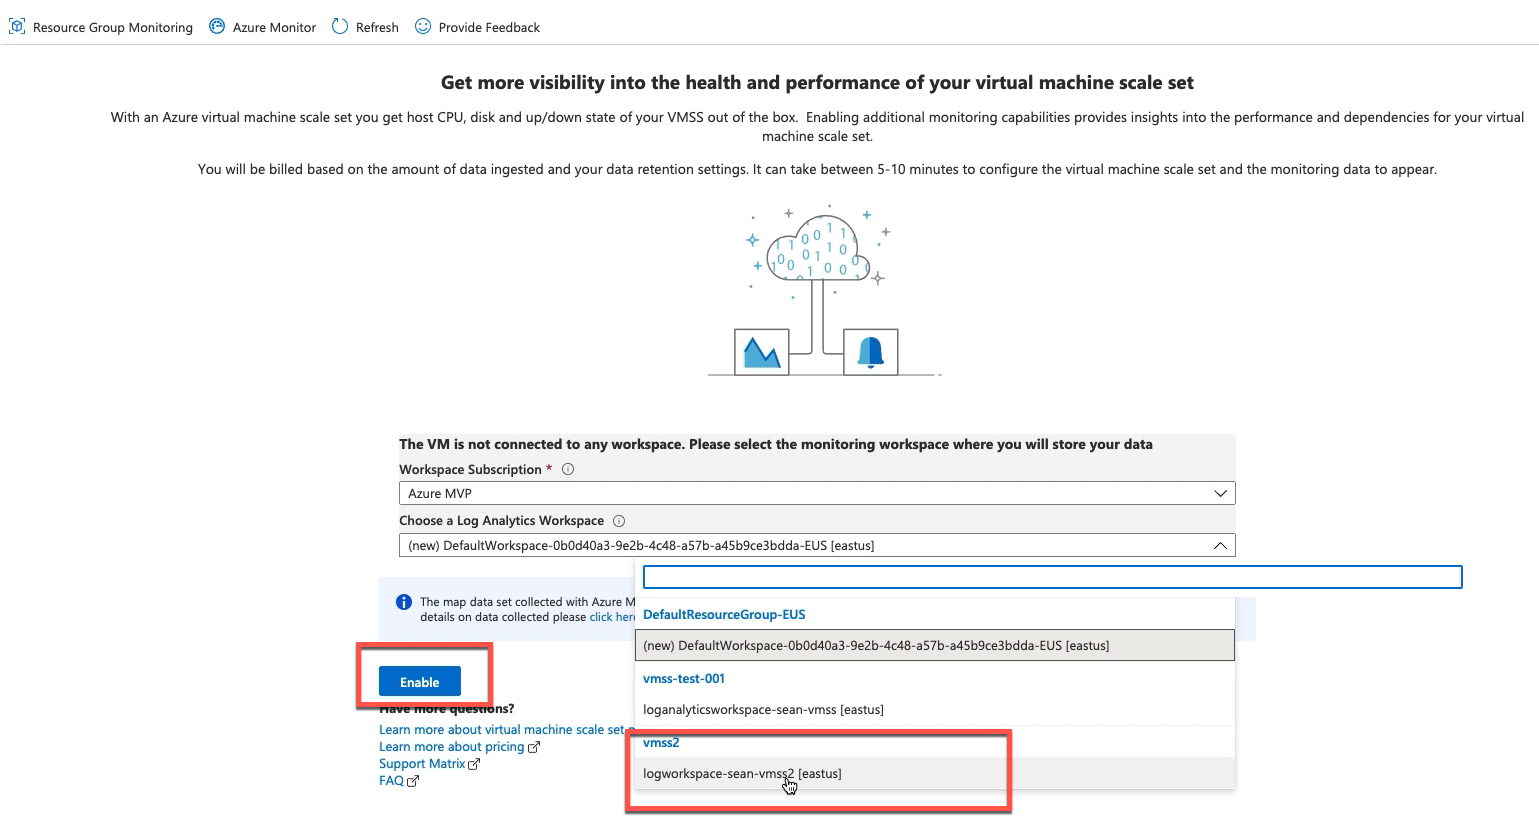
select the newly created log analytics workspace:
2.in monitor create a new alert rule
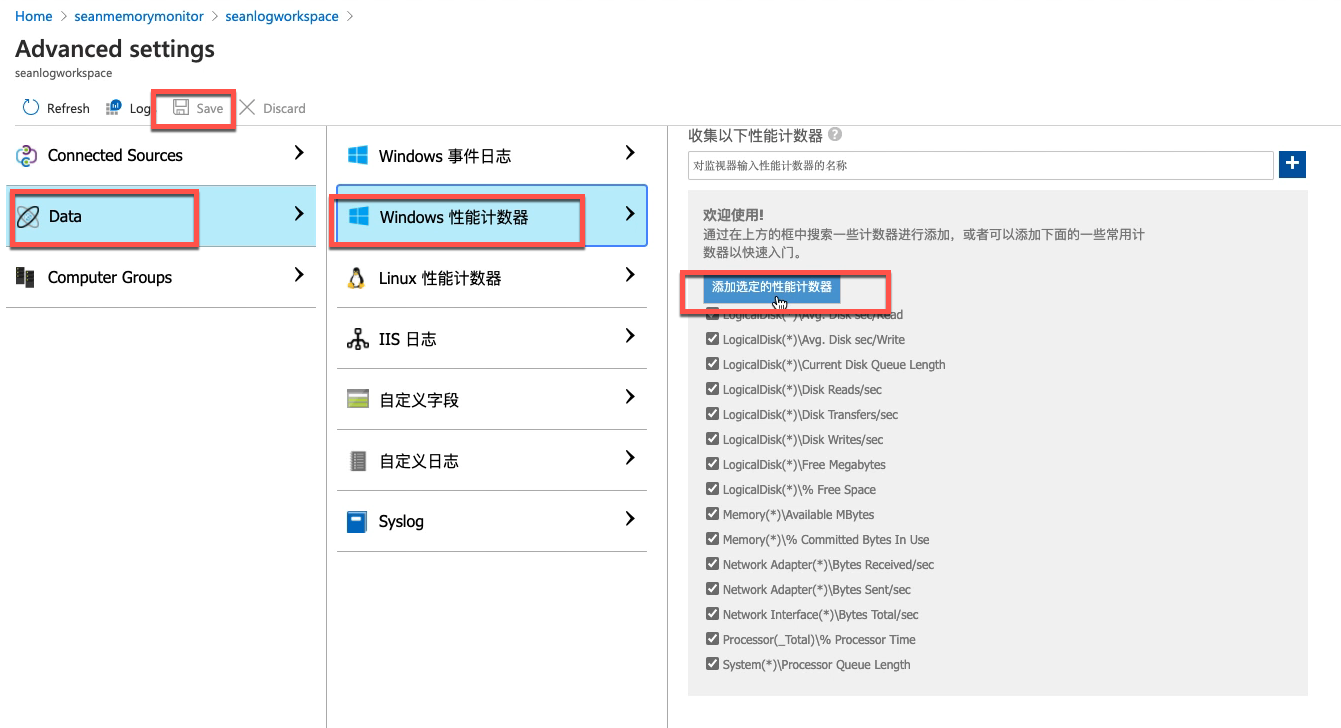
2.1 config log analytics agent collect data
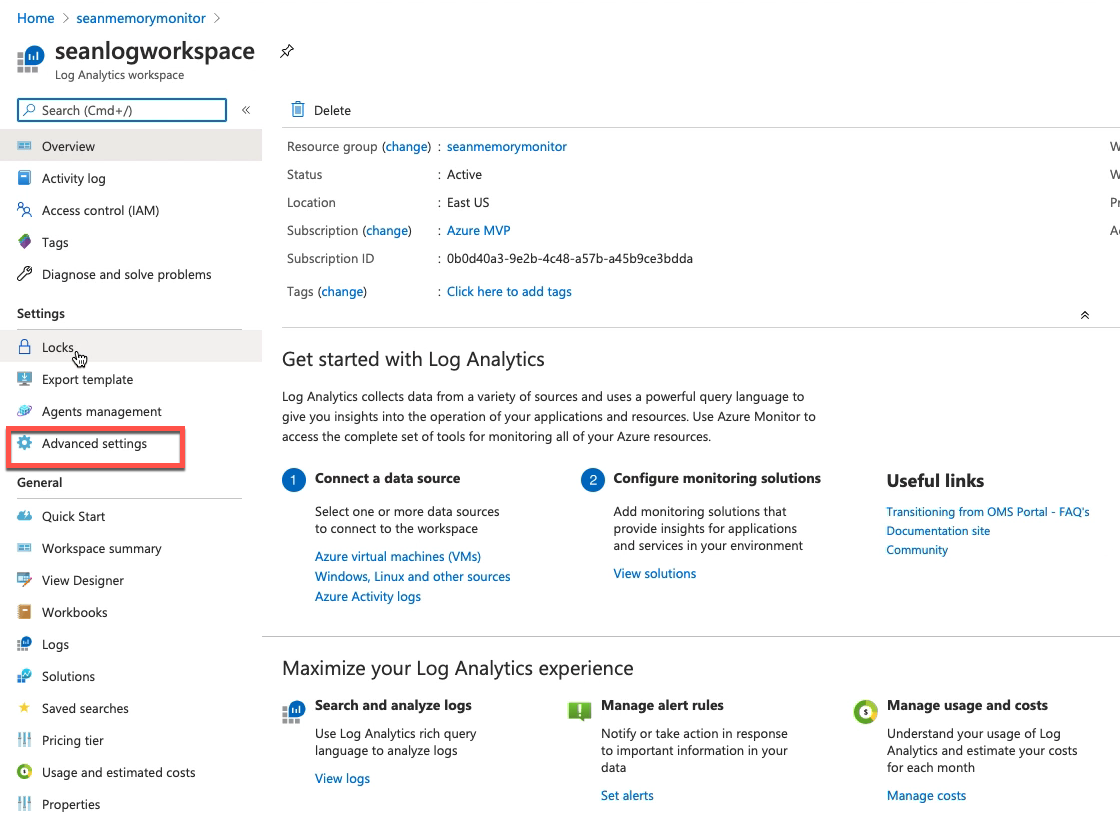
for windows system:
for linux system:
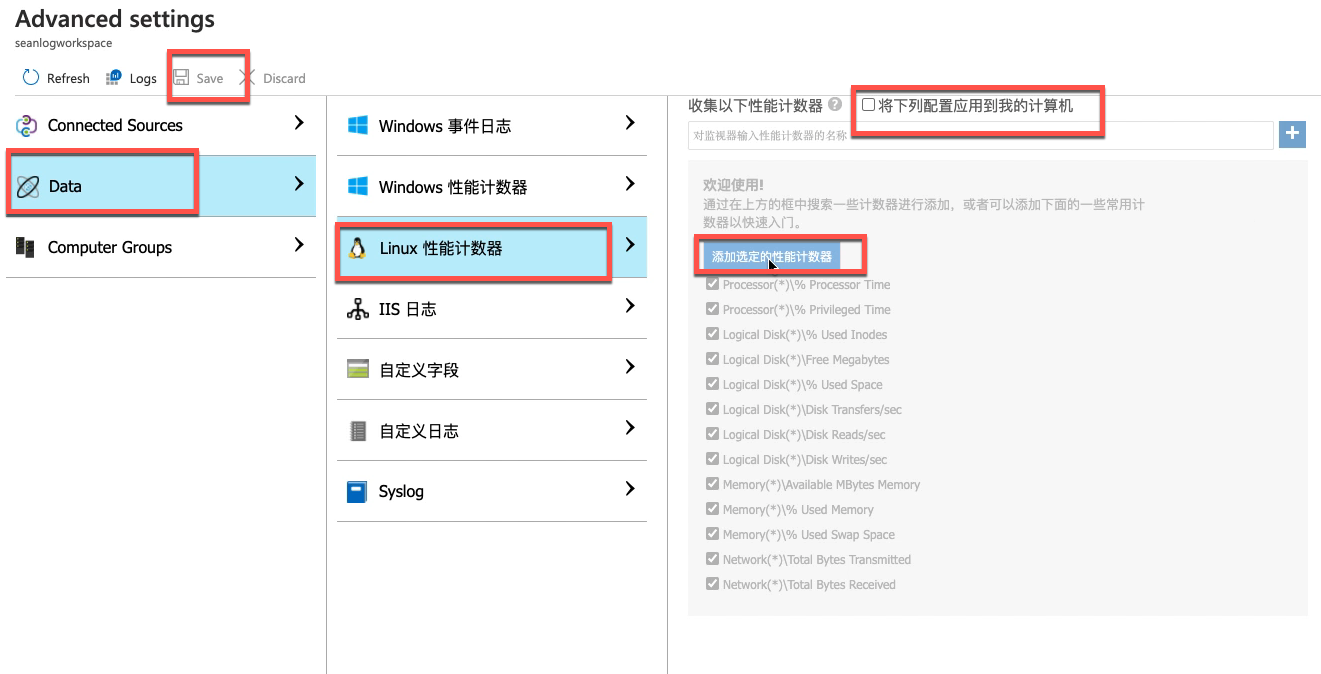
2.2 update vmss instances model
this screen shows your vm model should be update:
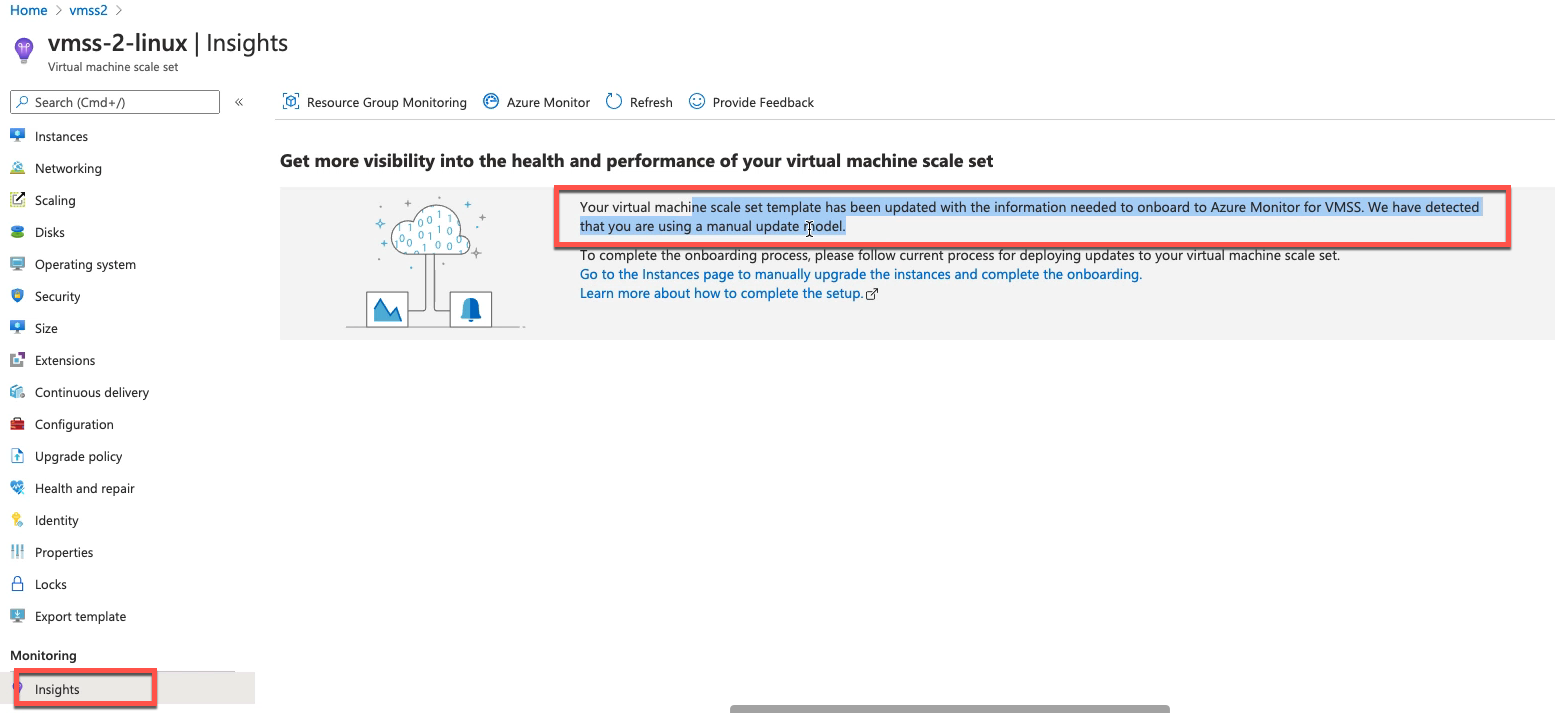
update vm model manually :

2.3 select log analytics workspace as scope
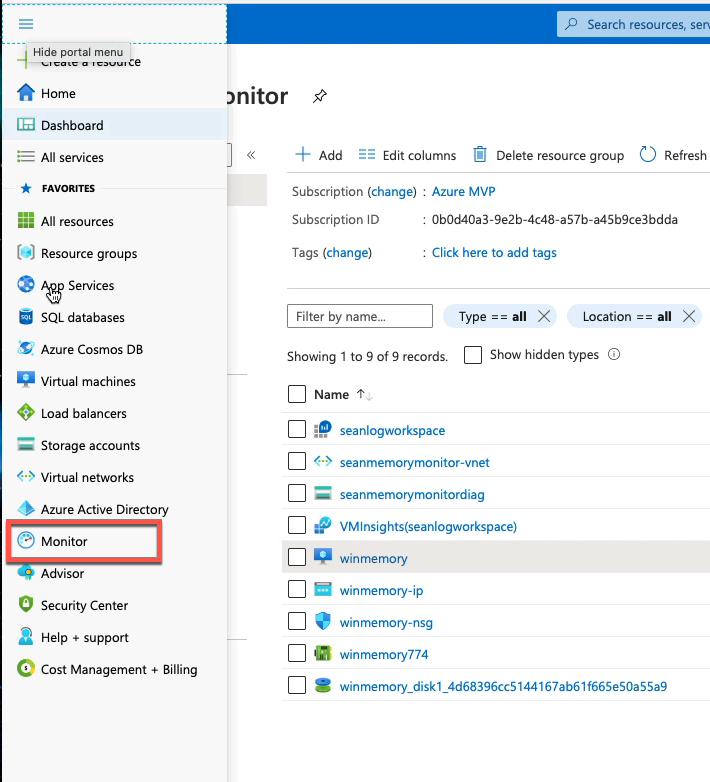
选择scope,此处应该为log analytics workspace,如果选择vm是无法正常工作的

or you can just enter the newly created log analytics workspace:
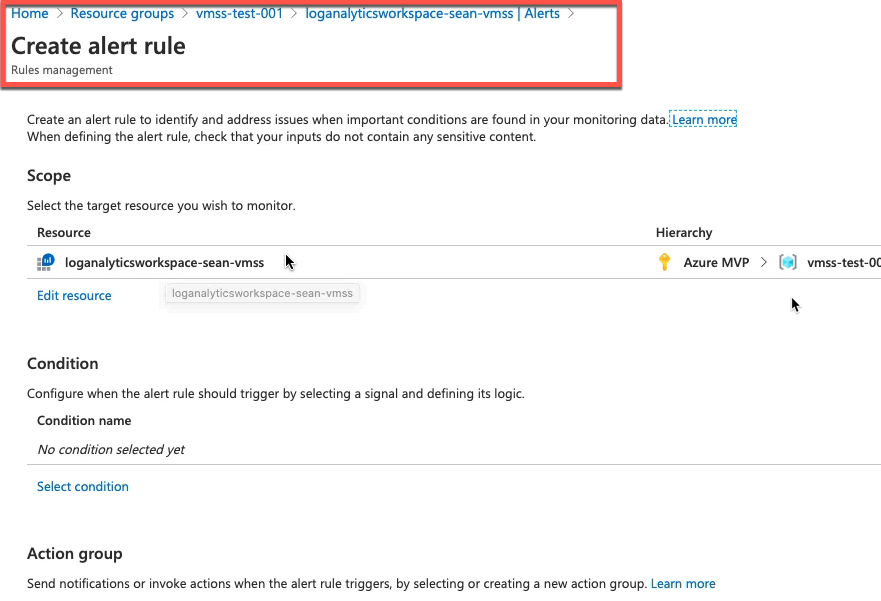
2.4 setup a condition

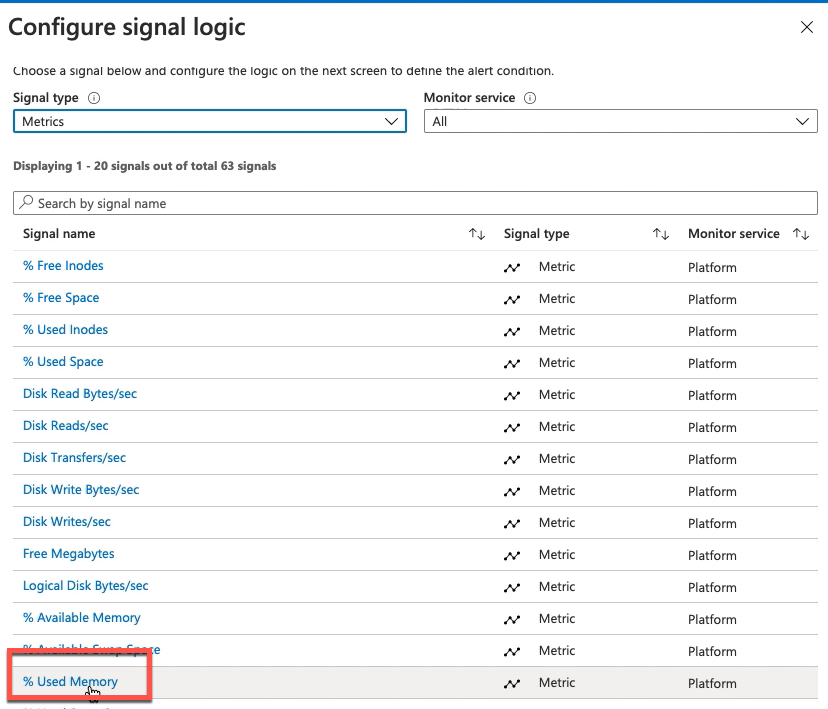
notice: the signal name are different between windows and linux
windows 和linux 系统的signal 那么不同,您需要确认您监控的到底是windows 还是 linux 再选择正确的signal name
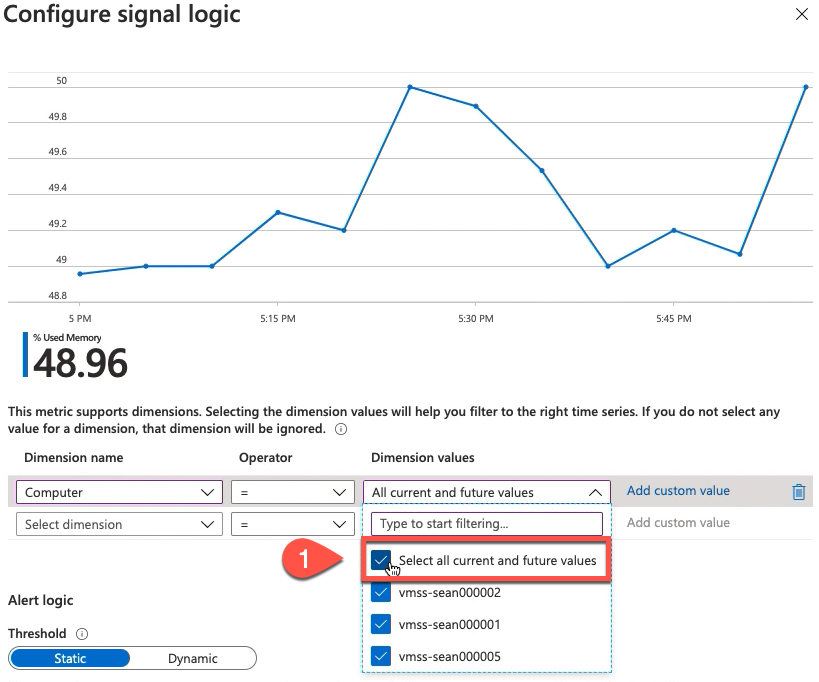
if you keep dimension name default, you will get the metrics data in aggregate for the vmss , not for each vm instances;
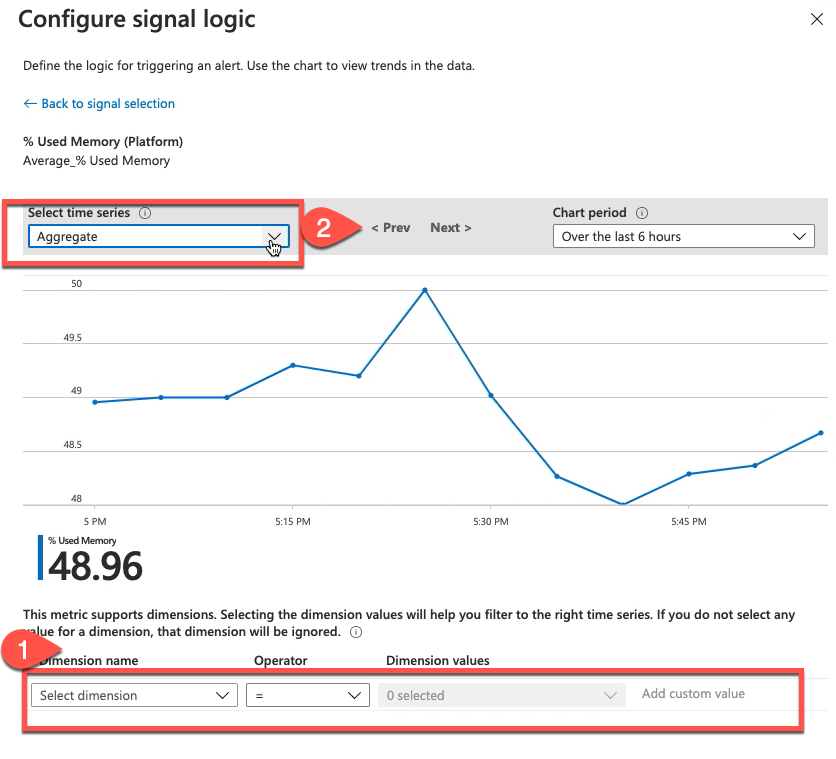
if you want to monitor each vm's memory ,please set up as below pic: select "select all current and future values"
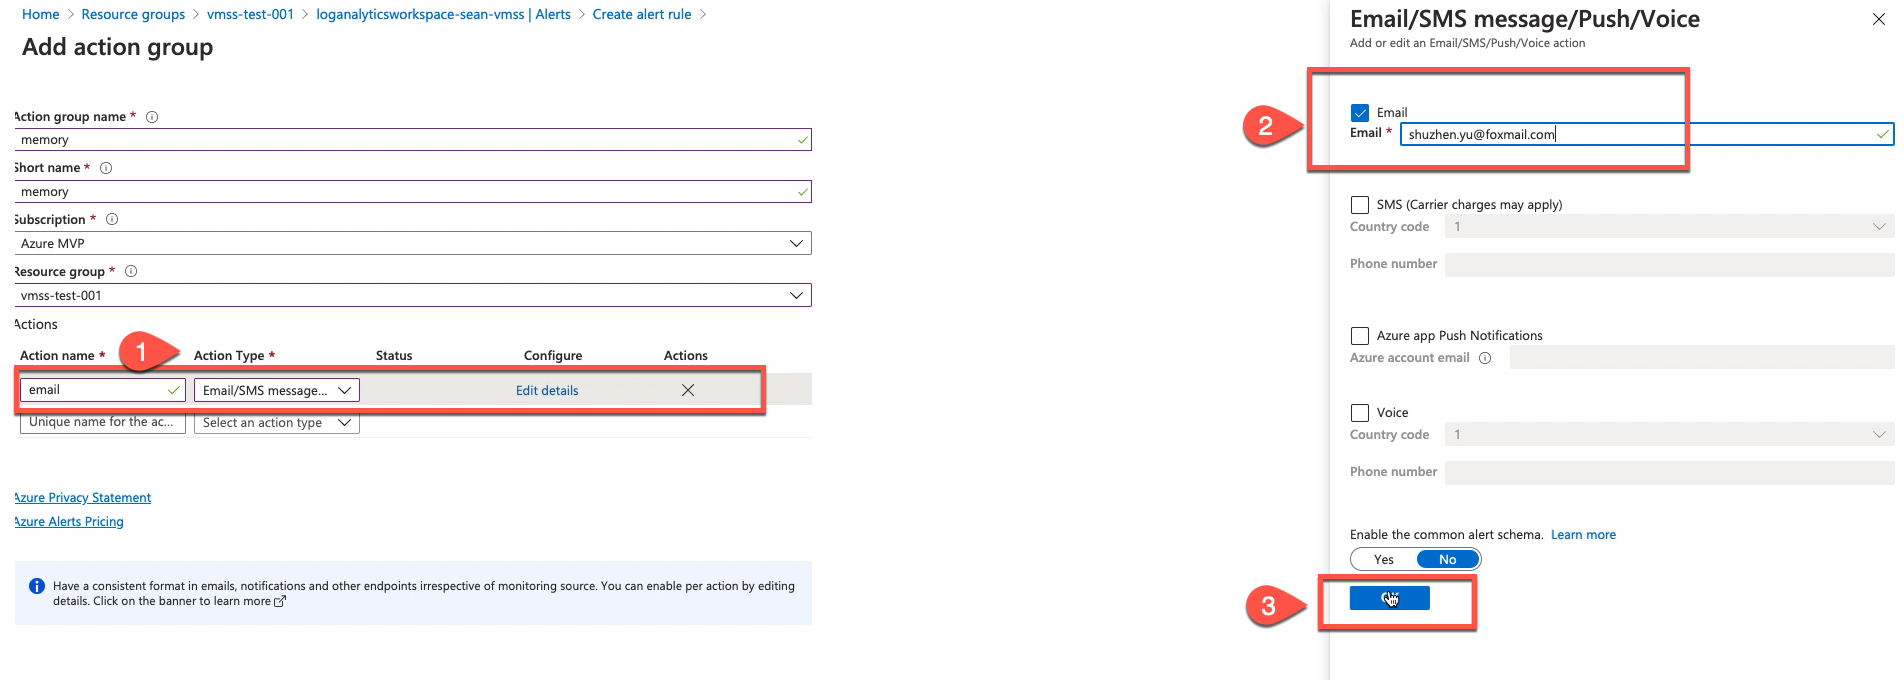
2.5 setup a action group
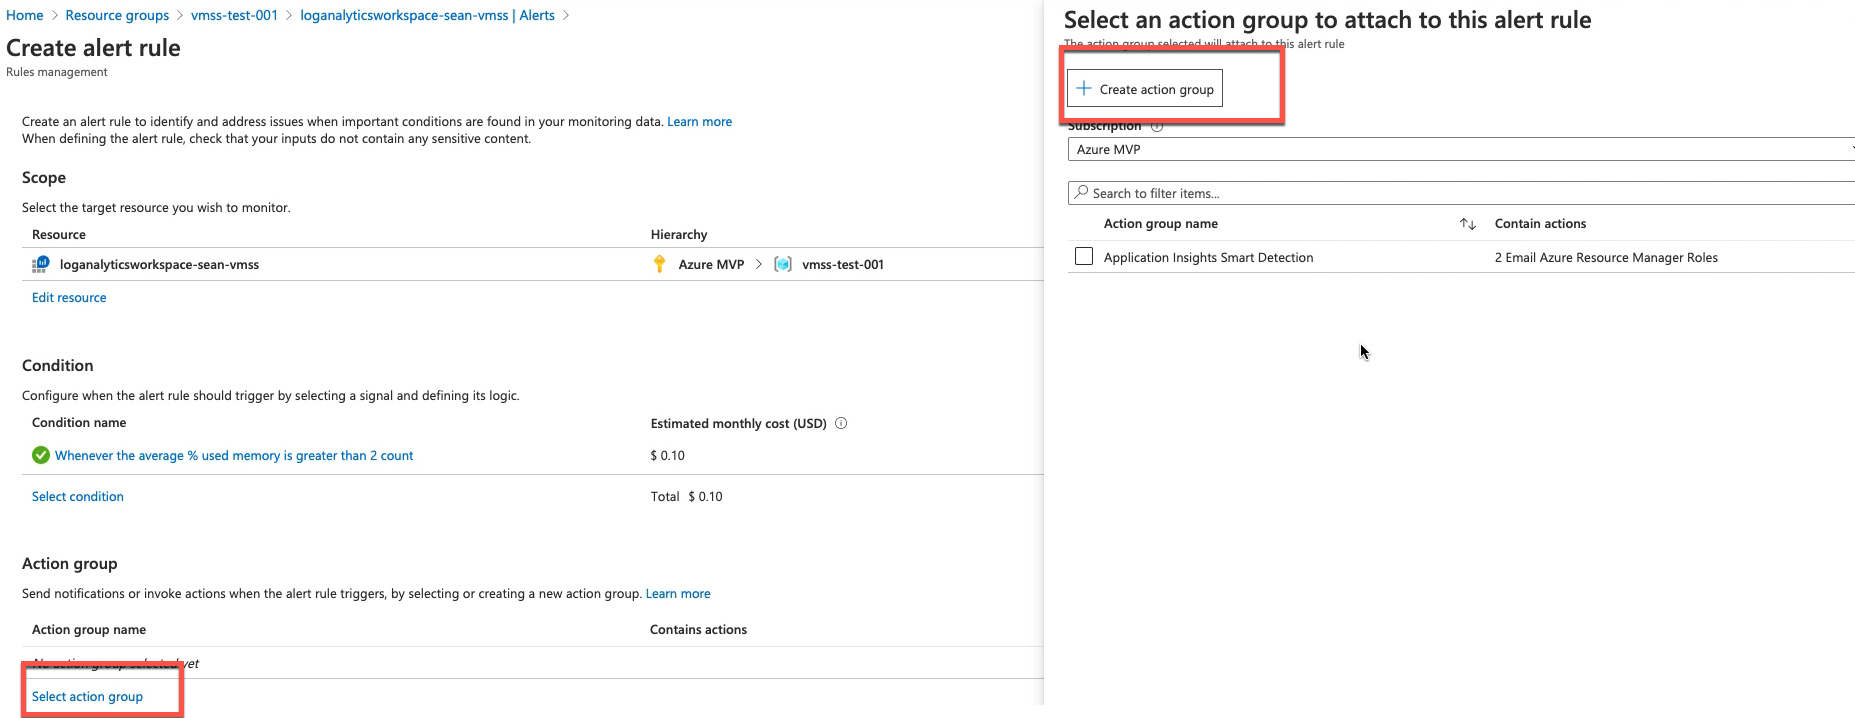
in this article, we only create an email alert:
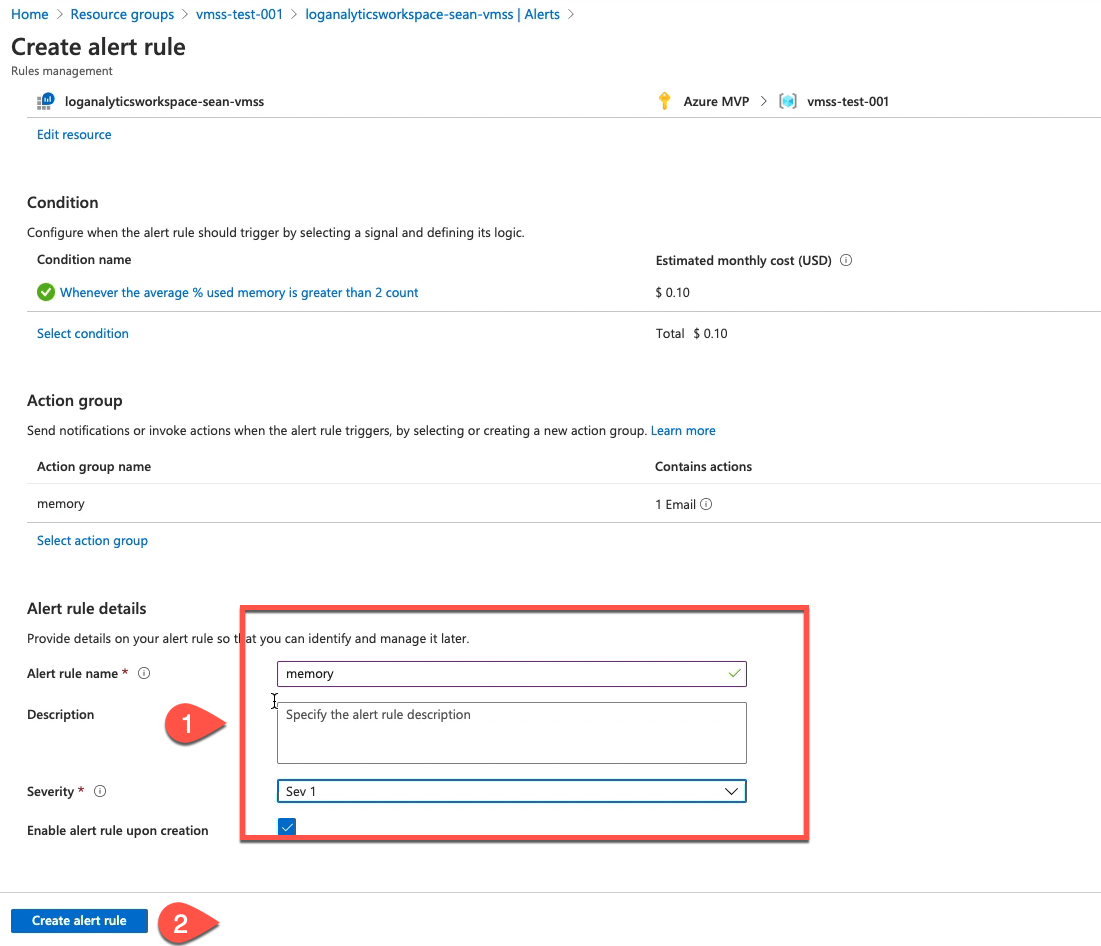
save the rule:
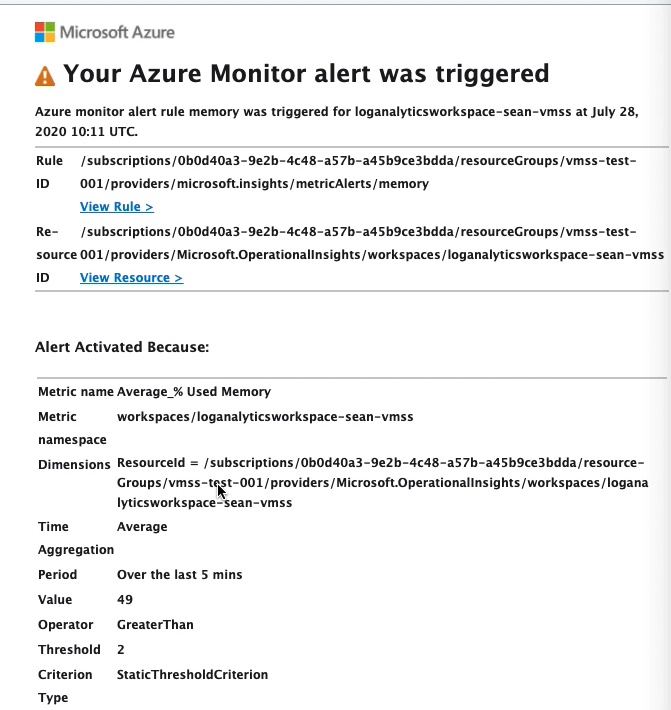
later, you will get email:


Thanks, It‘s useful.